( A STUDY BASED ON TURBINE OVERSPEED PROTECTION )
INTRODUCTION
Virtually all turbines are required to operate either at a fixed speed or over a range of fix speeds. Operating speed can range from less than 100 RPM for low head hydro turbines to up to 500,000 RPM for some micro gas turbines. The operating speed is held constant by ensuring that the input power matches the power needed by the driven machine. That balance is maintained by control system usually called the “governor”.
Relying on the governor only is not sufficient to guarantee safe turbine operation. Since the early turbine designs there have always been two independent systems responsible for keeping turbine within the safe operating speed range, they are governor and overspeed protection.
The first governors and overspeed units were mechanical devices. Further on hydraulics took over, later on to be replaced by analog electronic. However, these days governors and overspeed units are normally PLC devices driven by a specially designed software.
Since PLC took over turbine control there is always a discussion on how fast the PLC needs to be to do the job.
This paper is dealing with the same issue. It is trying to quantify overspeed protection requirements for prompt reaction. It is done by combining real world data with dynamic modelling and simulating.
Turbine overspeed protection system consists of Overspeed Trip Device (OSTD) connected to an emergency shutdown means. Each turbine type has its default emergency shutdown means. For steam turbines the OSTD acts to the main steam valve while with gas turbines it trips the main fuel valve. On Francis and Kaplan hydro turbines the OSTD commands the guide vanes to close at their maximum safe rate. With Pelton turbines a Jet Deflector is rapidly brought in to deflect the water away from the runner.
The OSTD can be either a stand-alone unit or an integral part of the turbine governor. It is normally Triple Modular Redundant (TMR) PLC system with 2 out of 3 or similar voting arrangements. Speed measurement is done through a toothwheel attached to the turbine shaft with duplicate or triplicate speed probes.
For most turbines there is a very rapid increase in speed if load is suddenly lost hence overspeed protection must be fast and reliable.
OVERSPEED PROTECTION SYSTEM RESPONSE TIME
The system response time consists of the OSTD Cycle Time plus Emergency Shutdown Mean Closing Time.
OSTD Cycle Time
PLC based OSTD operates in discrete steps cycles. The cycle consists of three major steps:
• speed measuring;
• processing the measurements;
• setting up the field outputs.
The cycle duration is application related. It depends on a number of factors and can vary during operation. It can be determined by testing each particular application in relevant operating scenarios.
OSTD Cycle Time= Speed Measuring Time + Control Program Scan Time + Output Polling Time
Speed Measuring Time;
This is the most time consuming step. The timing is determined by both the PLC I/O performance as well as by the physical requirements of the measuring process. Two basic speed measuring techniques have been in common use. One is the counting the pulses themselves while the other is to measure a level of the voltage being induced by teeth passing the probe. Both methods have their own challenges and solutions. In general, pulse counting is commonly preferred today. Regardless of which measuring method is used a time is required to obtain accurate and reliable speed readings.
Control Program Scan Time
This step allows PLC to go through the sequence. Modern Process Control PLC can achieve faster than 10 [ms/scan] performance for this step.
Output Polling Time
This step sets the field outputs. It can go as fast as 5 [ms/scan].
Emergency Shutdown Means Closing Time
Emergency shutdown means are spring and/or hydraulically driven assemblies. For smaller units it would normally be a mechanical device fitted with spring only. With larger units the emergency shutdown mean handles greater working fluid flows with larger valve forces and moving masses involved. Such devices are hydraulically driven. By default they would be slower then mechanical devices. However, the closing time requirement for today’s steam turbine main steam valve gets as short as 100 [ms].
OVERSPEED MODEL AND SIMULATION SCHEME
The process requirement for fast overspeed protection system response is quantified using dynamic simulation. The following scenario has been modeled and simulated;
Steam Turbine Generator Drive Unit going through the Full Load Rejection with the Governor being Out of Action
Turbine Simulated
A real world medium size steam turbine of 90MW output has been modeled. The turbine design characteristics are detailed in Appendix 1. The design of the model is explained in details in Appendix 2.
The modeled unit has its run-up time as tRun-up = 9.22 [s]. The run-up time is a term defined as a time required for unit to reach rated speed with the turbine running at full power without any drive load against it. The term is further on explained in Appendix 2. By default larger steam turbines have longer run-up times than smaller ones, however, that relationship is highly nonlinear and depends on various factors. A typical 200MW reheat unit with reaction blading would have the run-up time in excess of 13 [s].
PLC Simulated
For this simulation a set of five referent OSTD Cycle Times have been selected for comparison against a set of five Main Steam Valve (MSV) Closing Times. The selected OSTD Cycle Times are as follows:
a) 1 [ms] – Practically continuous;
b) 10 [ms] – Fast cycle;
c) 25 [ms] – Medium/Fast cycle;
d) 50 [ms] – Medium cycle;
e) 100 [ms] – Slow cycle.
MSV Simulated
Real world MSV closing patterns are approximated as per Chart 1. Assumed is a linear closing with a cushion at the end of the stroke. The end cushion is a common design practice aiming to protect the valve seat from being damaged by slamming.
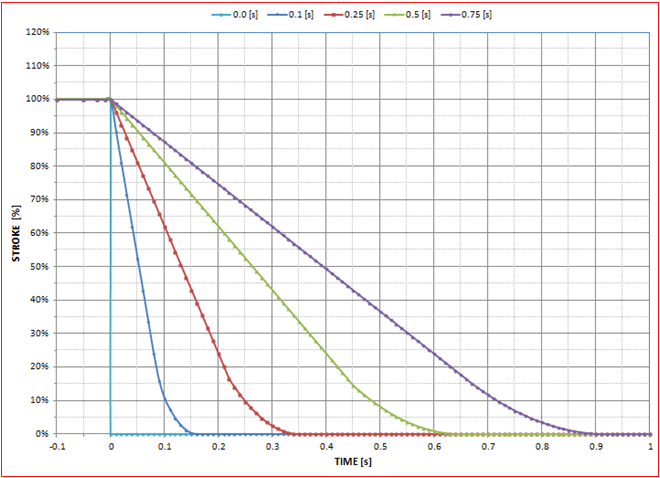
Chart 1: MSV closing patterns selected for simulation
The five MSV closing times selected are as follows:
a) 1 [ms] – Instantaneous closing;
b) 100 [ms] – Very fast closing;
c) 250 [ms] – Fast closing;
d) 500 [ms] – Medium closing;
e) 750 [ms] – Slow closing.
The simulation scheme is presented in Figure 1.
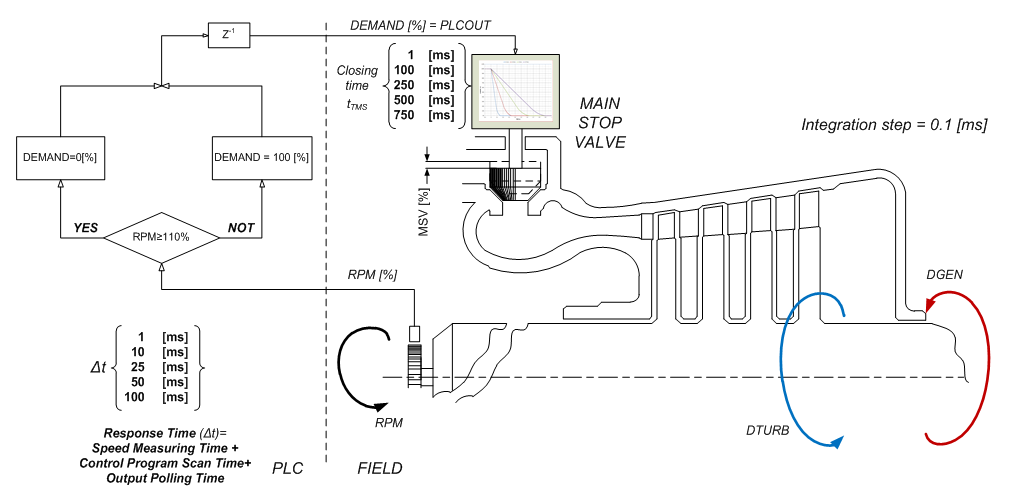
Figure 1: Steam Turbine Simulation Scheme
The integration step is set to 0.1 [ms].
At the beginning of the simulation the turbine output is balanced against the electrical load. The unit runs steadily at 3,000 RPM with the MSV fully open. At t=1 [s] the unit is instantly unloaded and starts to speed up. As there is no governor in place the MSV remains fully open.
The unit breaks 110% RPM (3,300) exactly at 0.9828 seconds after the full load rejection.
The PLC calculation is performed every 0.1 [ms]. In each cycle the current RPM reached is compared against 110% of the rated RPM. In a case the RPM is below 110% the PLC continues to keep the DEMAND at 100 [%]. If the RPM reaches 110% the DEMAND is set to 0[%]. However, what is sent out to the MSV in that step is not the calculated DEMAND but the DEMAND calculated and stored in the previous step. Once zero DEMAND is received the MSV starts closing as per Chart 1.
All above specified MSV Closing Times OSTD Cycle Times have been simulated by combining each OSTD Cycle Time against each of the MSV Closing Time.
SIMULATION RESULTS
The following process variables are selected as the most relevant for the process.
• RPM – speed [rpm]
• DTURB – normalized turbine output [%]
• DGEN – normalized generator load [%]
• PLCOUT – command sent from the OST to the MSV [%]
• MSV – normalized Main Stop Valve Stroke [%]
These variables are put together in a common trend for each of the OSTD Cycle Time – MSV Closing Time combination. The simulation result trends are attached in Appendix 1. The maximum overspeed reached (RPM MAX) has been recorded for every combination. The maximum overspeed reached for each MSV Closing Times against each OSTD Cycle times are presented in Table 1.
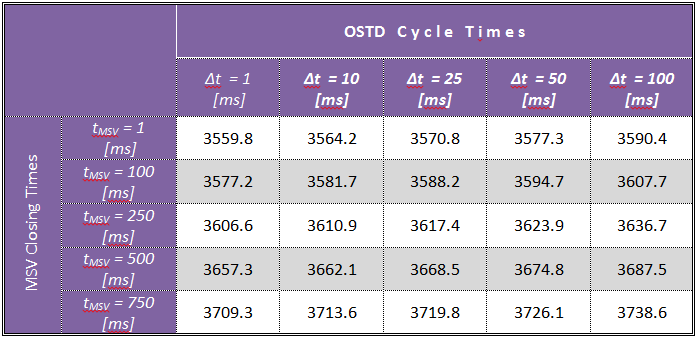
Table 1: Maximum overspeed reached for each MSV Closing Time and OSTD Cycle Time.
The results show the overspeed is a function of both, the OSTD Cycle Time as well as the MSV Closing Time. Any increase in either of these results in greater overspeed.
Table 2 illustrates how the MSV Closing Time affects the overspeed. The row MSV Closing Time of tMSV = 1 [ms] from Table 1 is omitted in Table 2. It is taken as a reference for all other MSV Closing Time rows. The reference overspeed for the each OSTD Cycle Time/MSV Closing Time combination has been subtracted from the exact overspeed reached with that particular OSTD Cycle Time and MSV Closing Time of tMSV = 1 [ms]. The values in Table 2 are actually the “contribution” of each particular MSV Closing Time to the final overspeed reached.
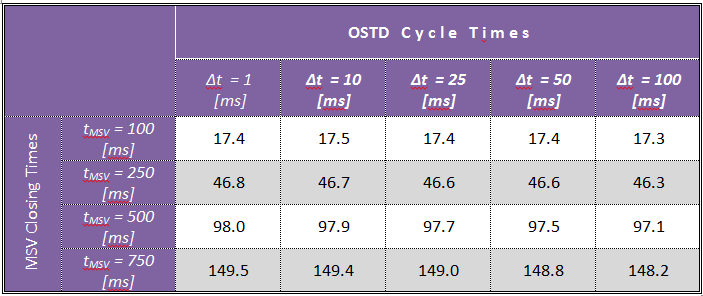
Table 2: MSV Closing Time “contribution” to the final overspeed.
Table 3 illustrates how OSTD Cycle Time affects the overspeed. The column of OSTD Cycle Time Δt = 1 [ms] is omitted from the Table 3. It is taken as a reference. The reference overspeed for each MSV Closing Time/OSTD Cycle Time combination has been subtracted from the overspeed reached with that particular MSV Closing Time and OSTD Cycle Time Δt = 1 [ms]. The results in Table 3 are the “contribution” of each particular OSTD Cycle Time to the final overspeed.
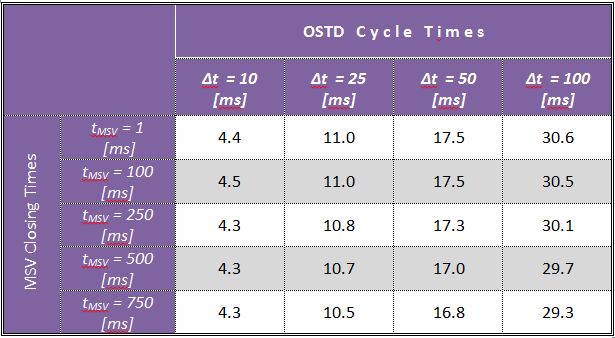
Table 3: OSTD Cycle Time “contribution” to the final overspeed.
The relationship between the MSV Closing Time and the final overspeed is monotonic. Every millisecond increase in the MSV Closing increases overspeed.
With regards to the OSTD Cycle Time the result is slightly different. There are two main factors that affect the final OSTD response time. One of the factors is the cycle duration while the other being the exact moment at which the speed reaches 110% value. If that moment is closer to the beginning of the new cycle the final overspeed is lower. If the 110% moment happens earlier i.e. closer to the current cycle beginning the overspeed is higher.
To test the influence of the 110% break through moment, a range of possibilities are simulated using the slowest valve tMSV = 750 [ms] with all the four OSTD Cycle Times. The ranges are presented in Table 4.
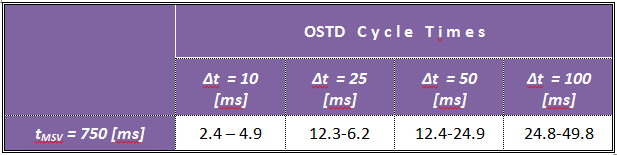
Table 4: Ranges of possible overspeeds for MSV Closing Time of tMSV = 0.75 [s]
Hence Table 2. says, for example if a turbine is equipped with the MSV that closes in 750 [ms] the closing time itself would bring the overspeed approximately 150 [RPM] higher compared to the same turbine equipped with a hypothetical instantaneously acting MSV. Further on Table 3. says, if the same turbine is equipped with an OSTD having the cycle of 100 [ms] that would bring the maximum overspeed approximately 20-50 [RPM] higher as compared to the same unit having the OSTD of a zero time cycle.
These figures are expected to be proportional to the unit run-up time. A typical 200MW reheat reaction steam turbine manufactured by one of the prominent Japanese manufacturers would have a tRun-up of 13 [s]. That would make:
• 106 [RPM] – “contribution” of a MSV Closing Time of tMSV= 750 [ms] to the maximum overspeed;
• 14-35 [RPM] – “contribution” of a OSTD Cycle Time of Δt =100 [ms] to the maximum overspeed;
For gas turbines with the compressor and the turbine rotors fixed together the contribution rate would be less than with steam turbines. This assumption is based on the commonly accepted industry facts and practices. Quantifying the contribution rate associated with gas turbines would require a similar study to this done.
CONCLUSIONS
Both the MSV Closing Time delay and the OSTD Cycle Time delay contribute to the final overspeed.
The MSV is a mass-spring-damper system that requires some definite time to close. Today’s industry requirement for the MSV Closing Time is at a level of 100 [ms]. Significant efforts are put into new designs to achieve such a short closure times. Older style MSV with large hydraulic volumes driven by low pressure hydraulic systems have difficulty to comply with this requirement.
OSTD Cycle Time contribution to the final overspeed is significantly less than the contribution due to real world MSV Closing Time.
This study in addition to the author personal experience indicates that an ultra-fast PLC is not what a turbine control applications necessary needs. What makes something a good turbine governor is a reliable PLC hardware operated by a well designed software fitted to each particular application.